Data Interpretation :: Bar charts
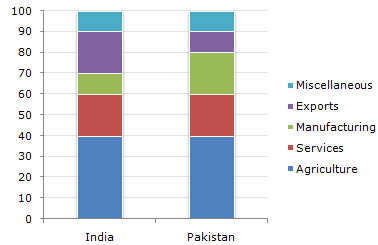
The following bar chart shows the composition of the GDP two countries (India and Pakistan).
Composition of GDP of Two Countries

-
If the total GDP of Pakistan is Rs. 10,000 crore, then a GDP accounted for by Manufacturing is ?
-
What fraction of India's GDP is accounted for by Services ?
-
If the total GDP of India is Rs.30,000 crores, then the GDP accounted for by Agriculture, Services and Miscellaneous is ?
-
Which country accounts for higher earning out of Services and Miscellaneous together ?
-
If the total GDP is the same for both the countries, then what percentage is Pakistan's income through agriculture over India's income through Services ?


 Whatsapp
 Facebook

