Data Interpretation :: Pie charts
Study the following pie-chart and the table and answer the questions based on them.
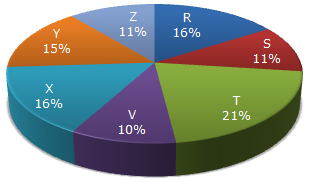
Proportion of Population of Seven Villages in 1997
| Village | % Population Below Poverty Line |
| X | 38 |
| Y | 52 |
| Z | 42 |
| R | 51 |
| S | 49 |
| T | 46 |
| V | 58 |
-
If the population of village R in 1997 is 32000, then what will be the population of village Y below poverty line in that year?
-
The ratio of population of village T below poverty line to that of village Z below poverty line in 1997 is:
-
Find the population of village S if the population of village X below poverty line in 1997 is 12160.
-
If in 1998, the population of villages Y and V increase by 10% each and the percentage of population below poverty line remains unchanged for all the villages, then find the population of village V below poverty line in 1998, given that the population of village Y in 1997 was 30000.

 Whatsapp
 Facebook


 y = [
y = [ Population of village Y below poverty line = 52% of 30000 = 15600.